Consensus
Visualizing points of disagreements to help group reach consensus
Groups are often charged with reaching consensus on important decisions. For complex decisions with multiple criteria, verbal and written discourse alone may impede groups from pinpointing disagreements. Our research explores how technology affects group consensus building beyond traditional methods of discourse. We introduce ConsensUs, a novel visualization tool that highlights disagreement by asking group members to quantify their subjective opinions across multiple criteria. Our paper was admitted by ACM TSC. Also, I will be the presenter of our paper on CHI 2018!
Duration
Jun. 2016-Sep. 2016
Location
Design Lab @ UC San Diego
My Role
Competitive analysis, System design, Front-end implementation, User experiment, Qualitative data analysisCollaborators
Weichen Liu | Jacob Browne | Ming Yang | Steven Dow
Research Method
Contextual Inquiry, Focus Group, Cognitive Walkthrough, Survey, Usability testing
Tools
Sketch, Axure, D3/JavaScript, Meteor

Literature Review
In literature review, we want to find out why people struggles to reach consensus and existing ways to utilize decision making process. Our findings are as below:
Opinions are omitted
Some members avoid voicing dissent to help maintain internal social relationships in work groups. People may also influence one another so much so that they ignore their own concerns and only focus on the publicly stated arguments by others.
Anchoring bias
Individual members may be subject to an anchoring effect where people are attached to their initial opinion and unmoved by a group’s opinion. Individuals are also known to exhibit confirmation bias where they resist any disconfirming evidence to their initial preferences.
False consensus
Failing to surface disagreements may lead to the situation where group
members overestimate the extent to which their opinions align with others.
Assuming conflicts do surface, groups may still choose “win-lose” solutions that fail to address the concerns of all members.
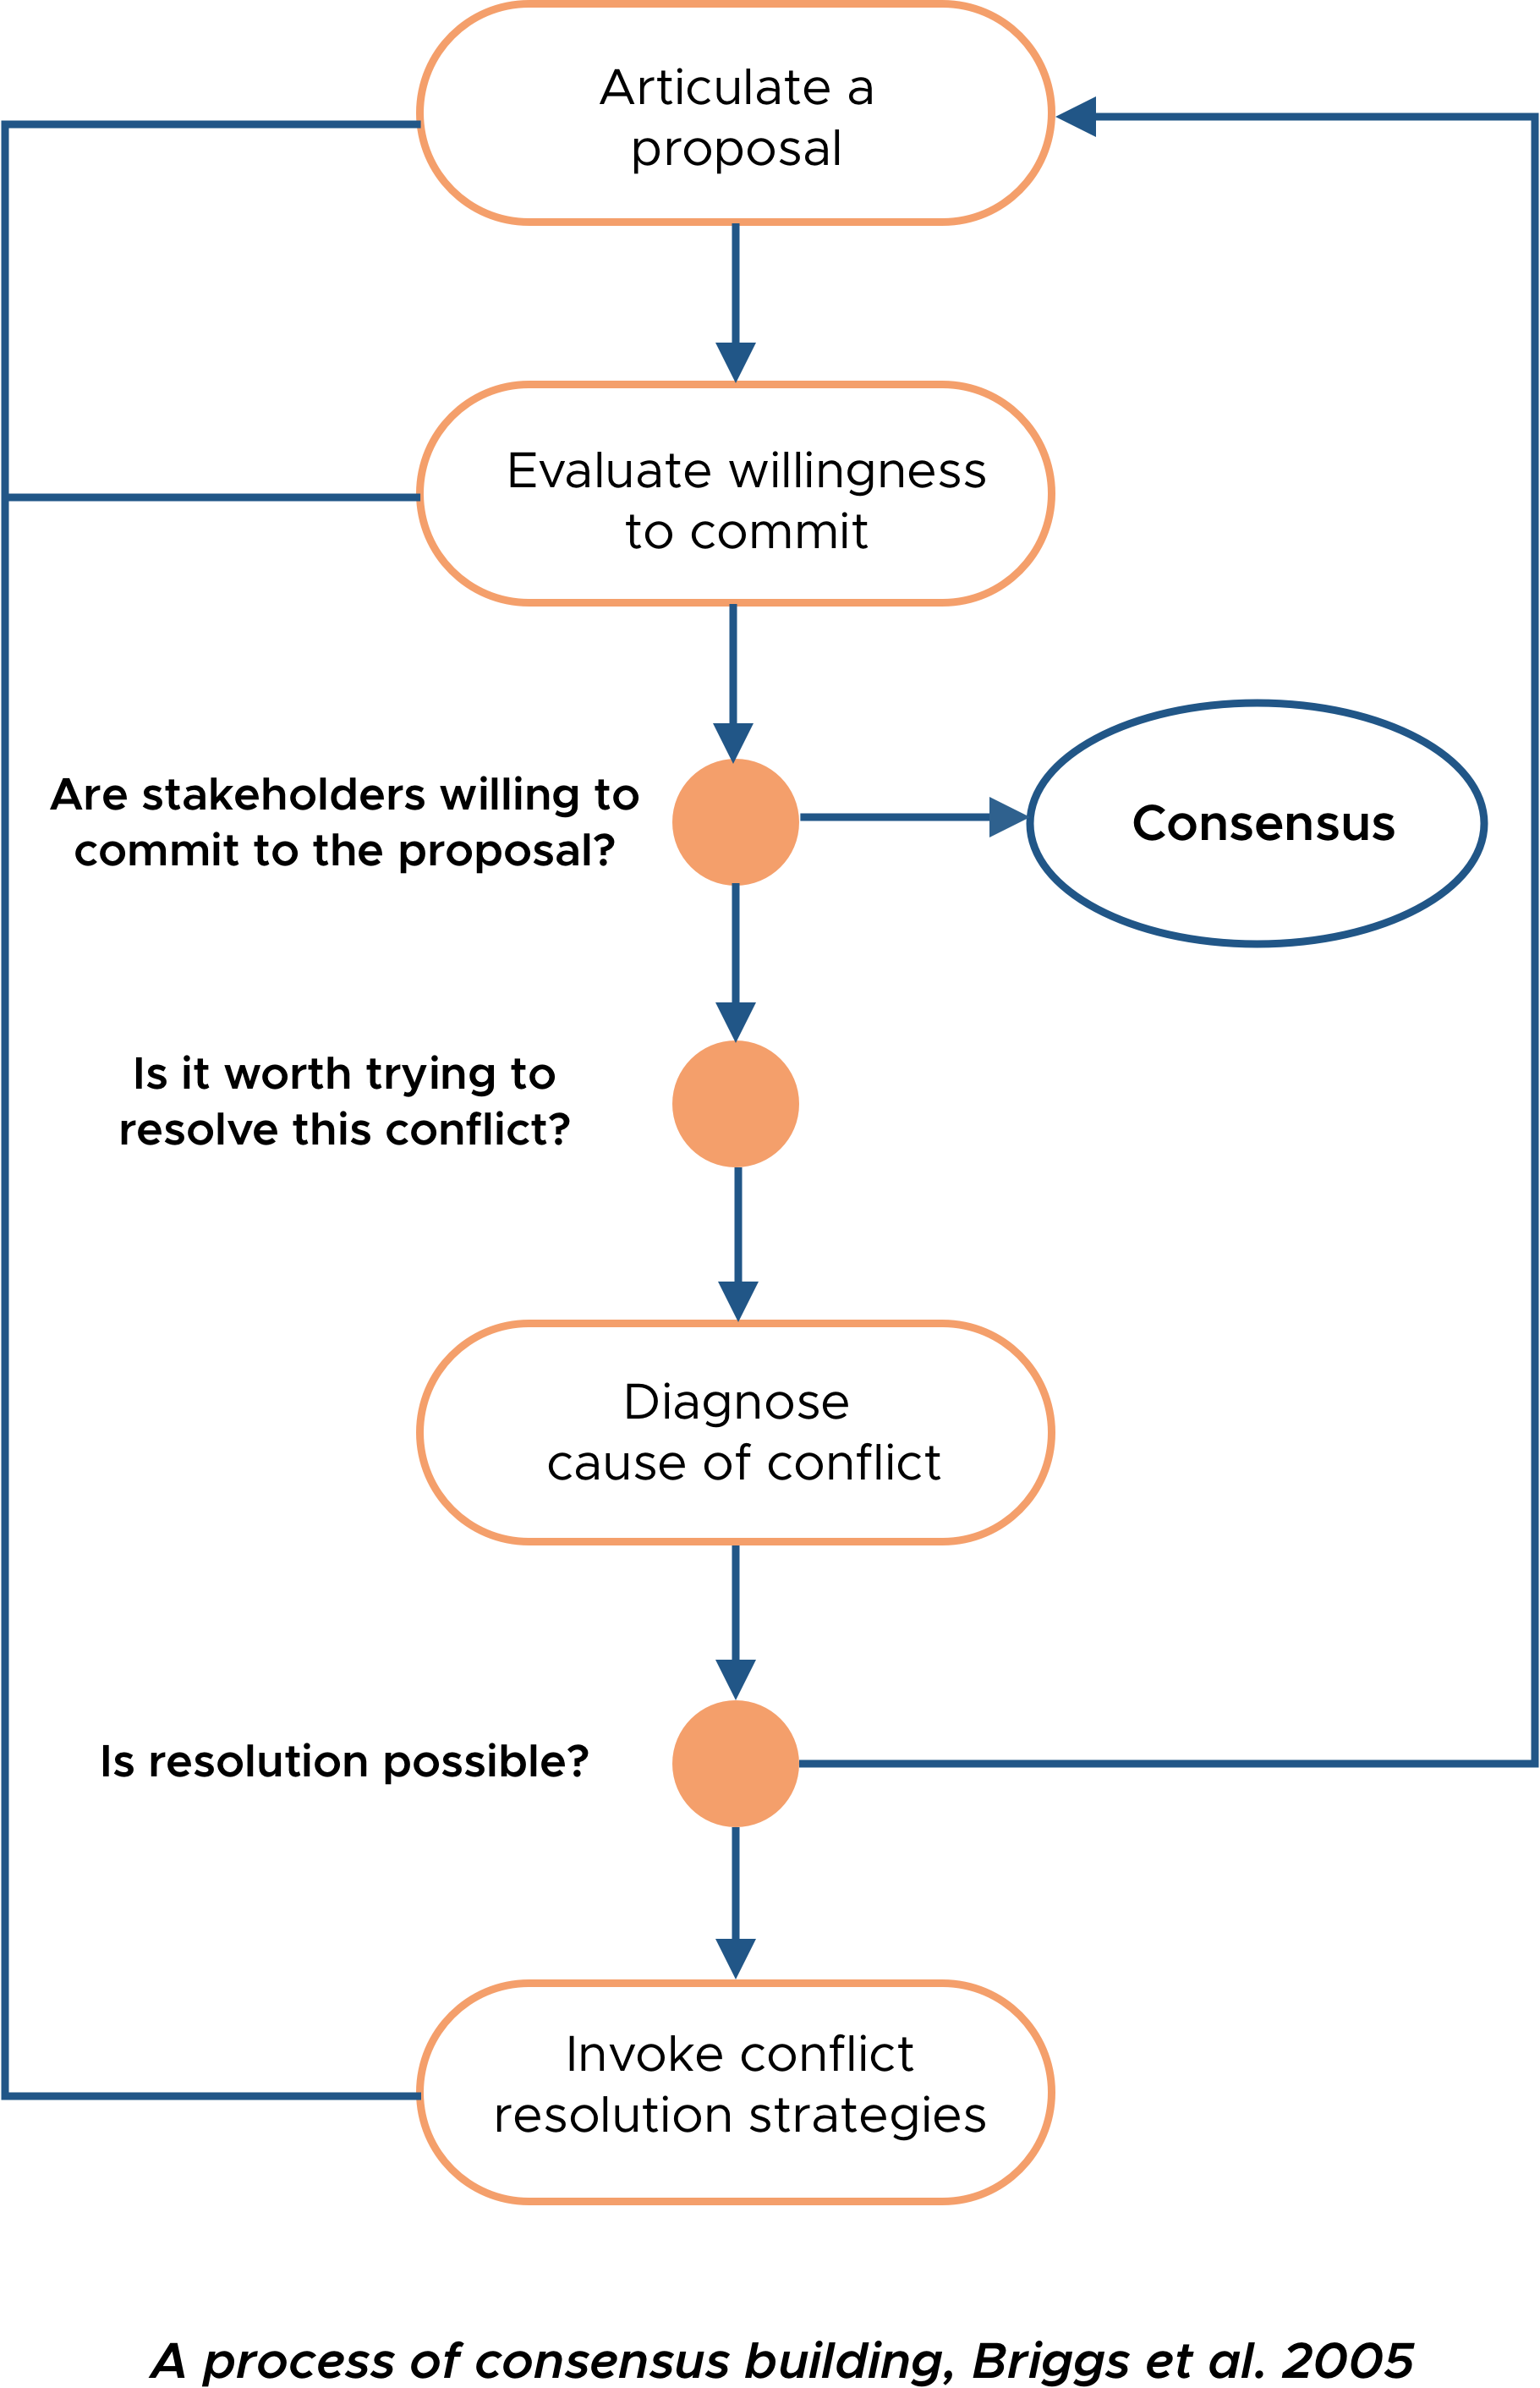
Strategies to facilitate consensus building
Anchoring in group decision processes can be reduced if a group’s preferences are revealed after all group members have articulated individual preferences. One paper raised a consensus building model. According to the paper, a successful consensus building process establishes criteria to compare alternatives, externalizes agreement and disagreement to help scaffold the discussion, ensures equal participation, and maintains a holistic view of the group’s opinion.
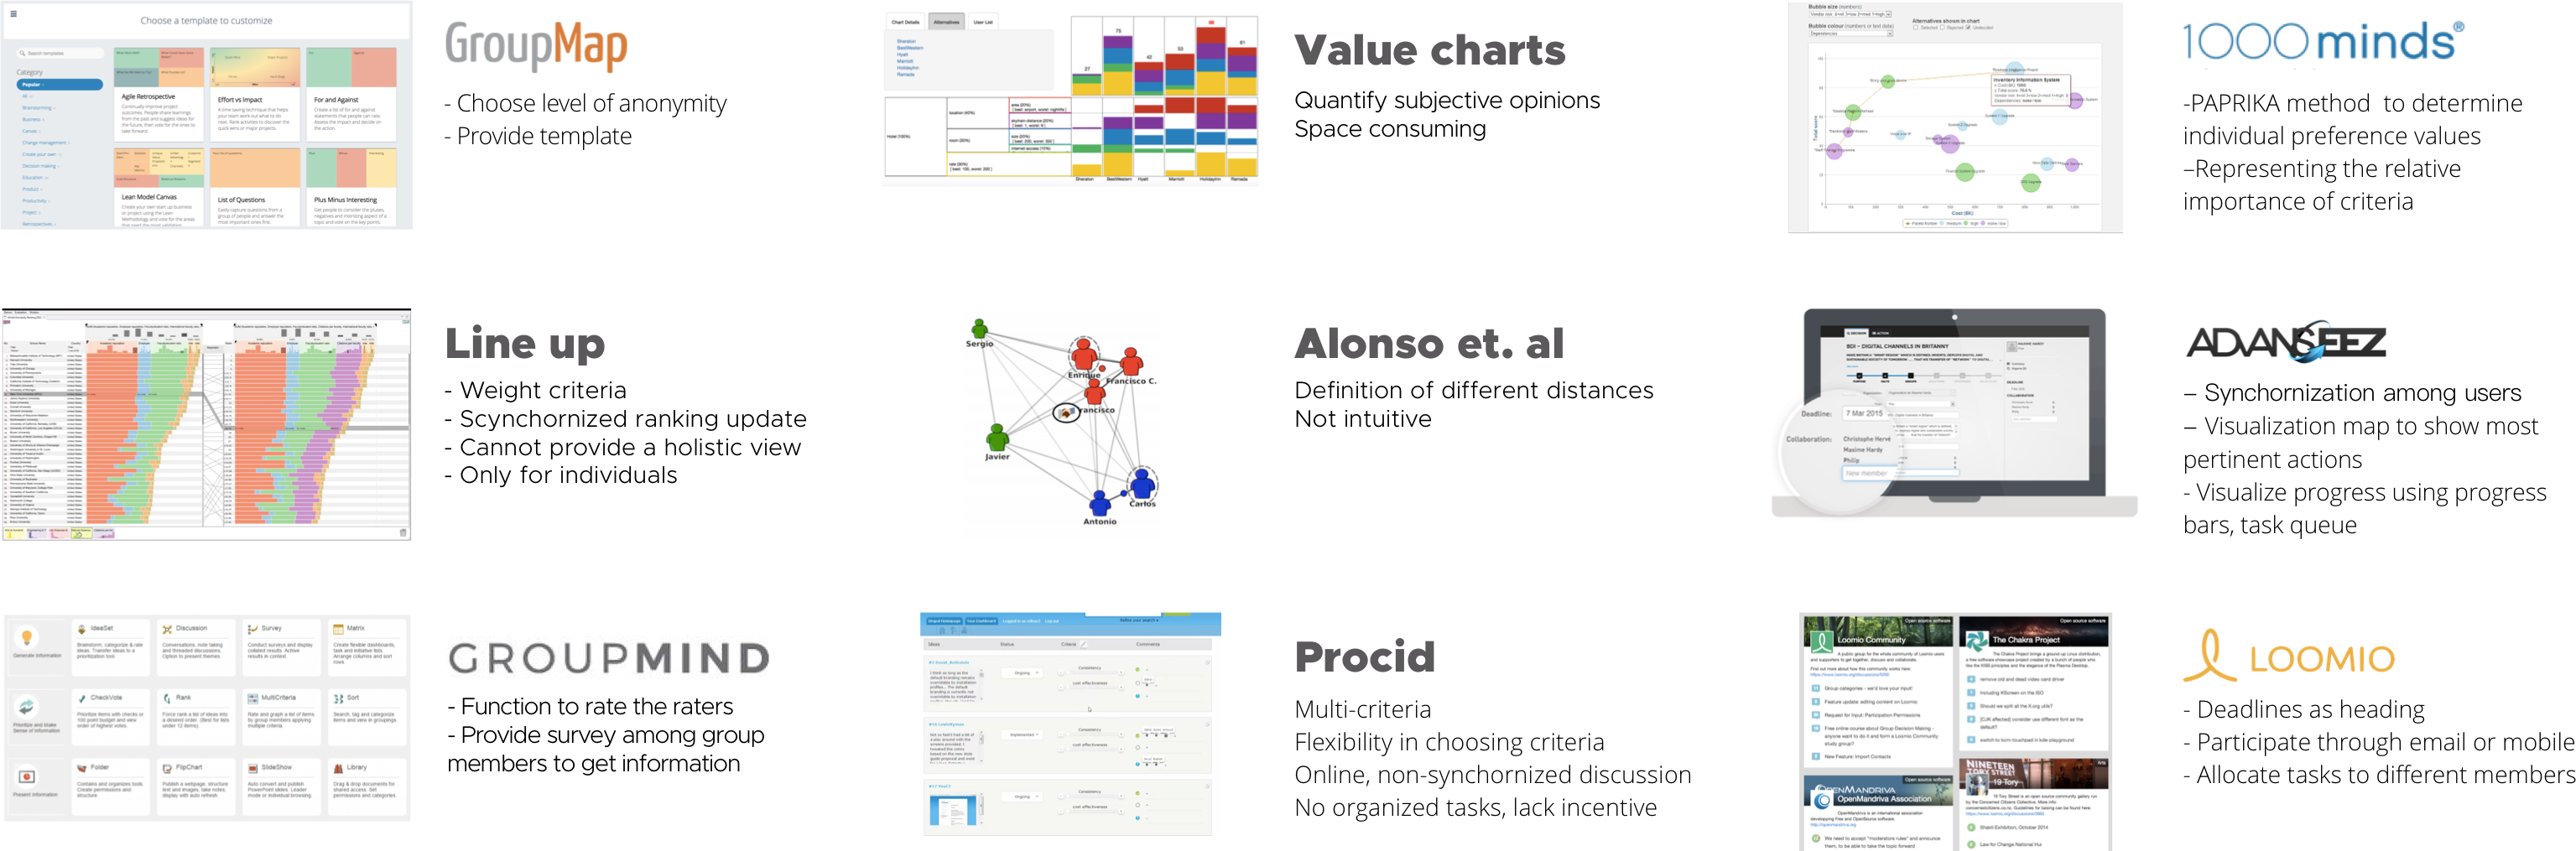
Competitive Analysis
In competitive analysis, we find that numerous technologies have emerged to support multi-criteria comparisons. Also, a number of tools attempt to create a structured decision process where visualization plays a prominent role.
Visualization Design
Design criteria
Visualizing points of disagreements
While most group support systems aggregate information in some way or another, few of them pay specific attention towards highlighting points of disagreement. In theory, externalizing points of agreement and disagreement can help scaffold the discussion and help a group diagnose conflicts.Holistic view of opinion
Within the independent voting interface, participants can rank all candidates simultaneously in one view, rather than rating them independently or only selecting a preferred option. In the group interface, ConsensUs provides an overview that allows group members to easily consider the different criteria and alternatives without having to switch between different views.Independent thinking phase before discussion
Anchoring in group decision processes can be reduced if a group’s preferences are revealed only after all group members have articulated their individual preferences. Our system asks participants to first provide independent opinions before showing the group overview.Equal representation of opinion
To insure that each participant feels valued and considered in the decision-making process, we designed the system to give all decision makers equal representation and ability to influence the group average opinion. In other words, the system does not add weights to any members’ ratings, although this could be explored in future work.Design Overview
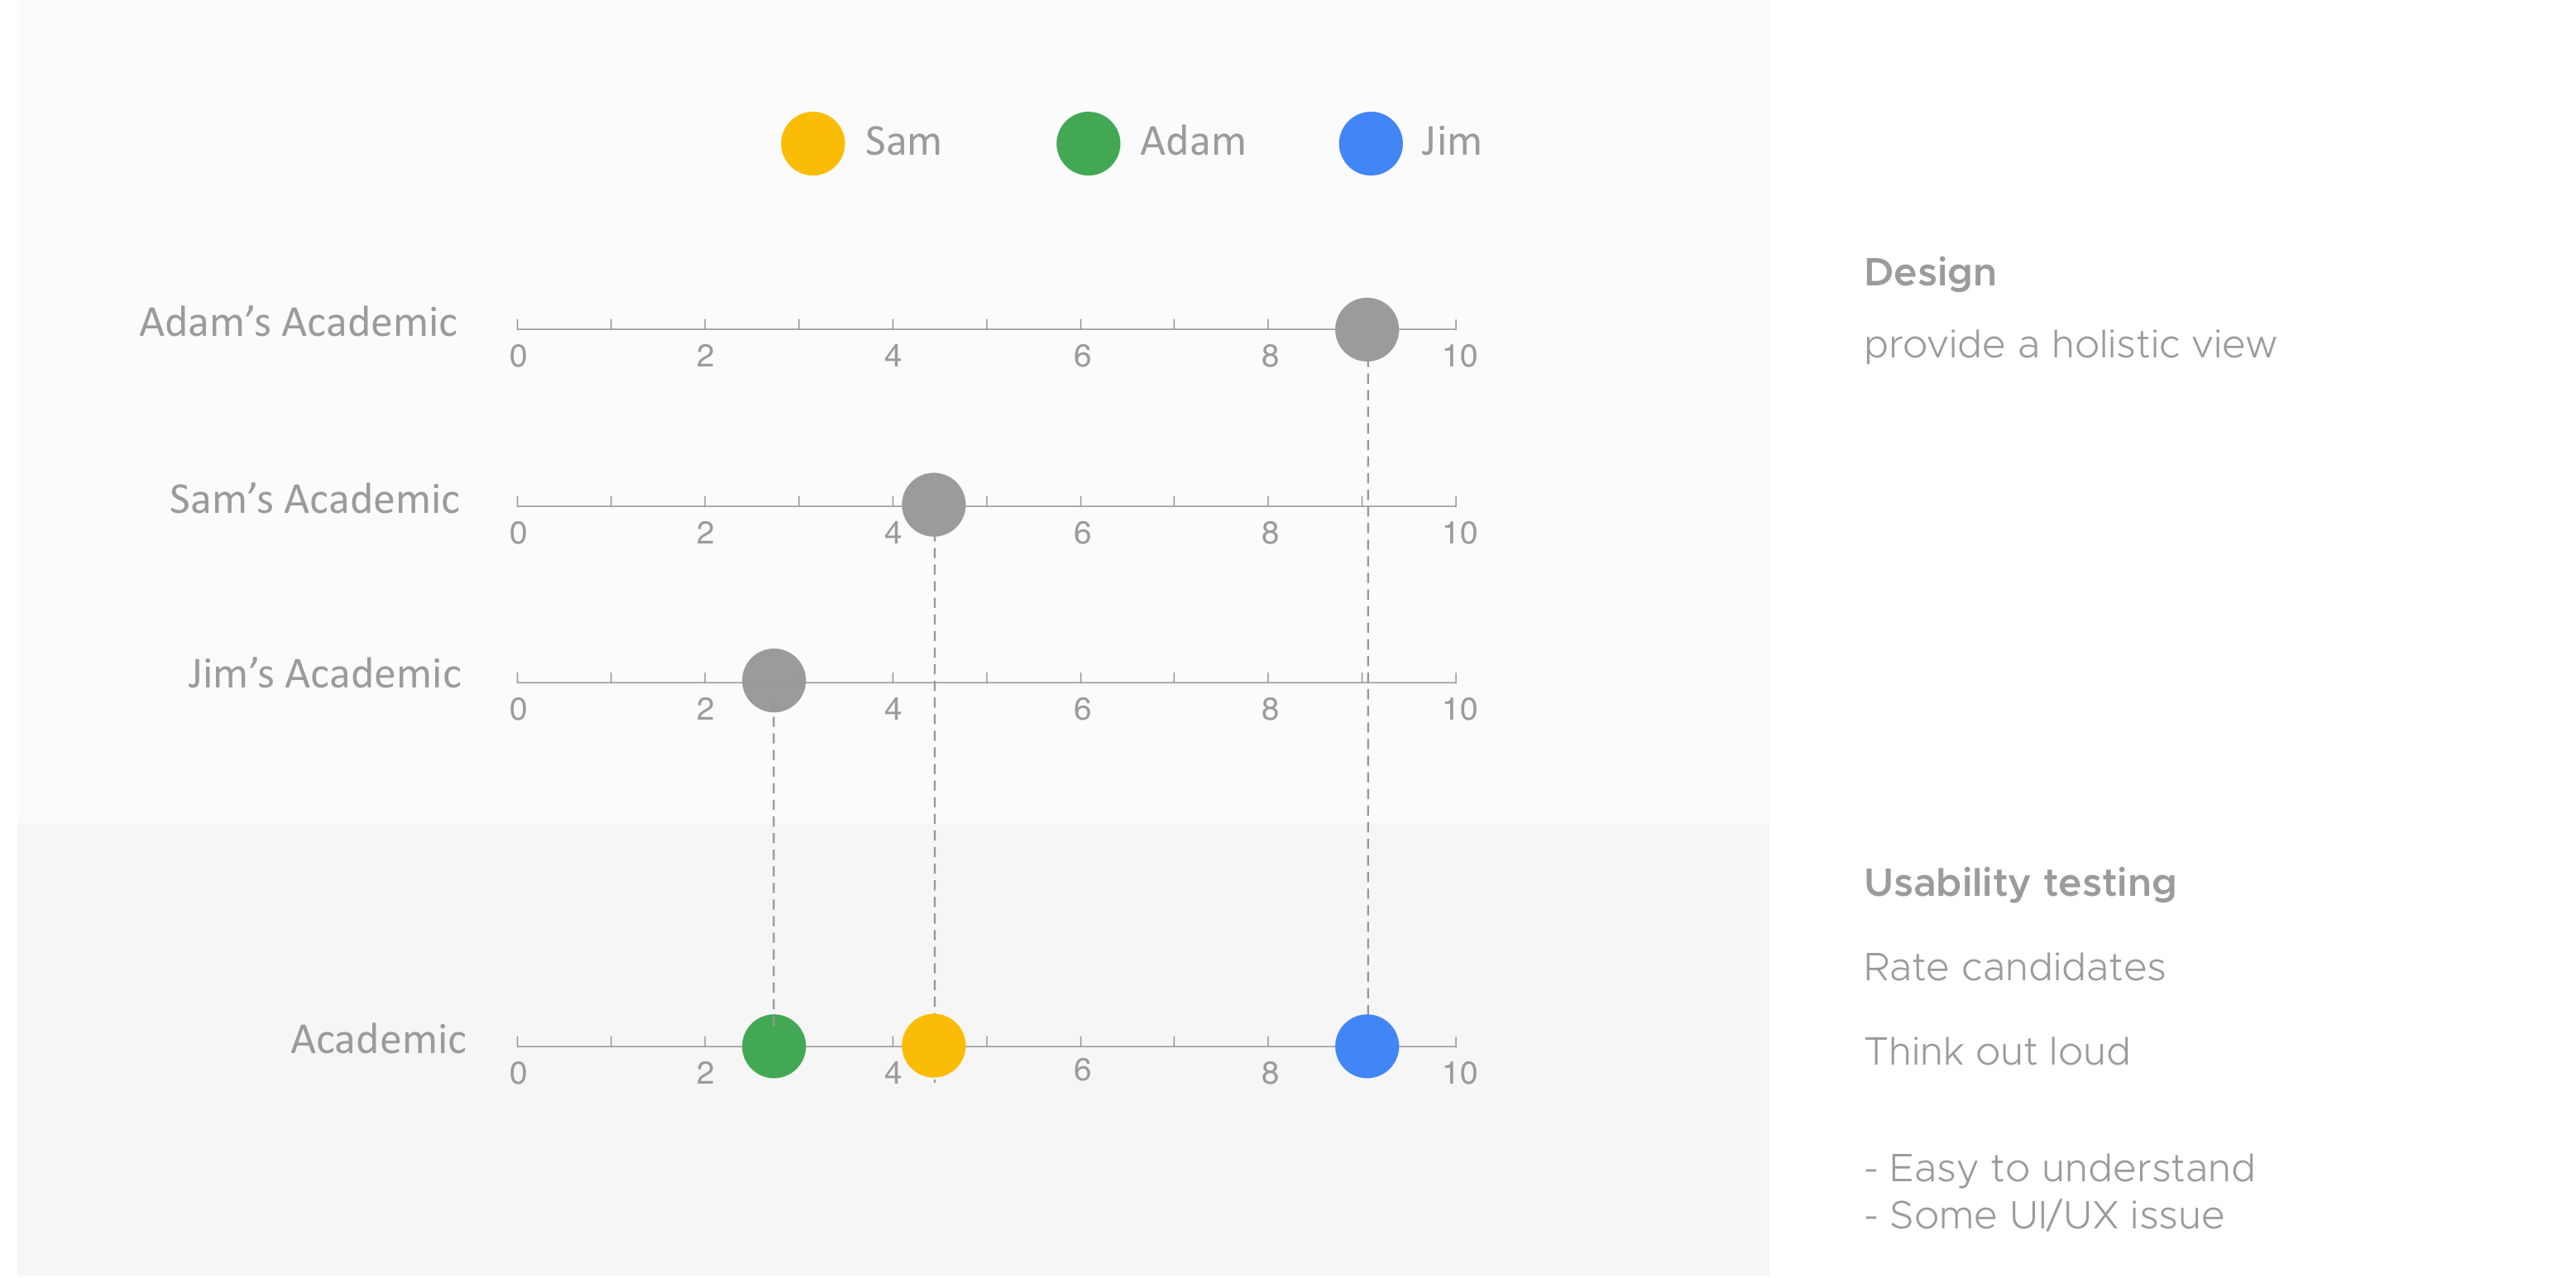
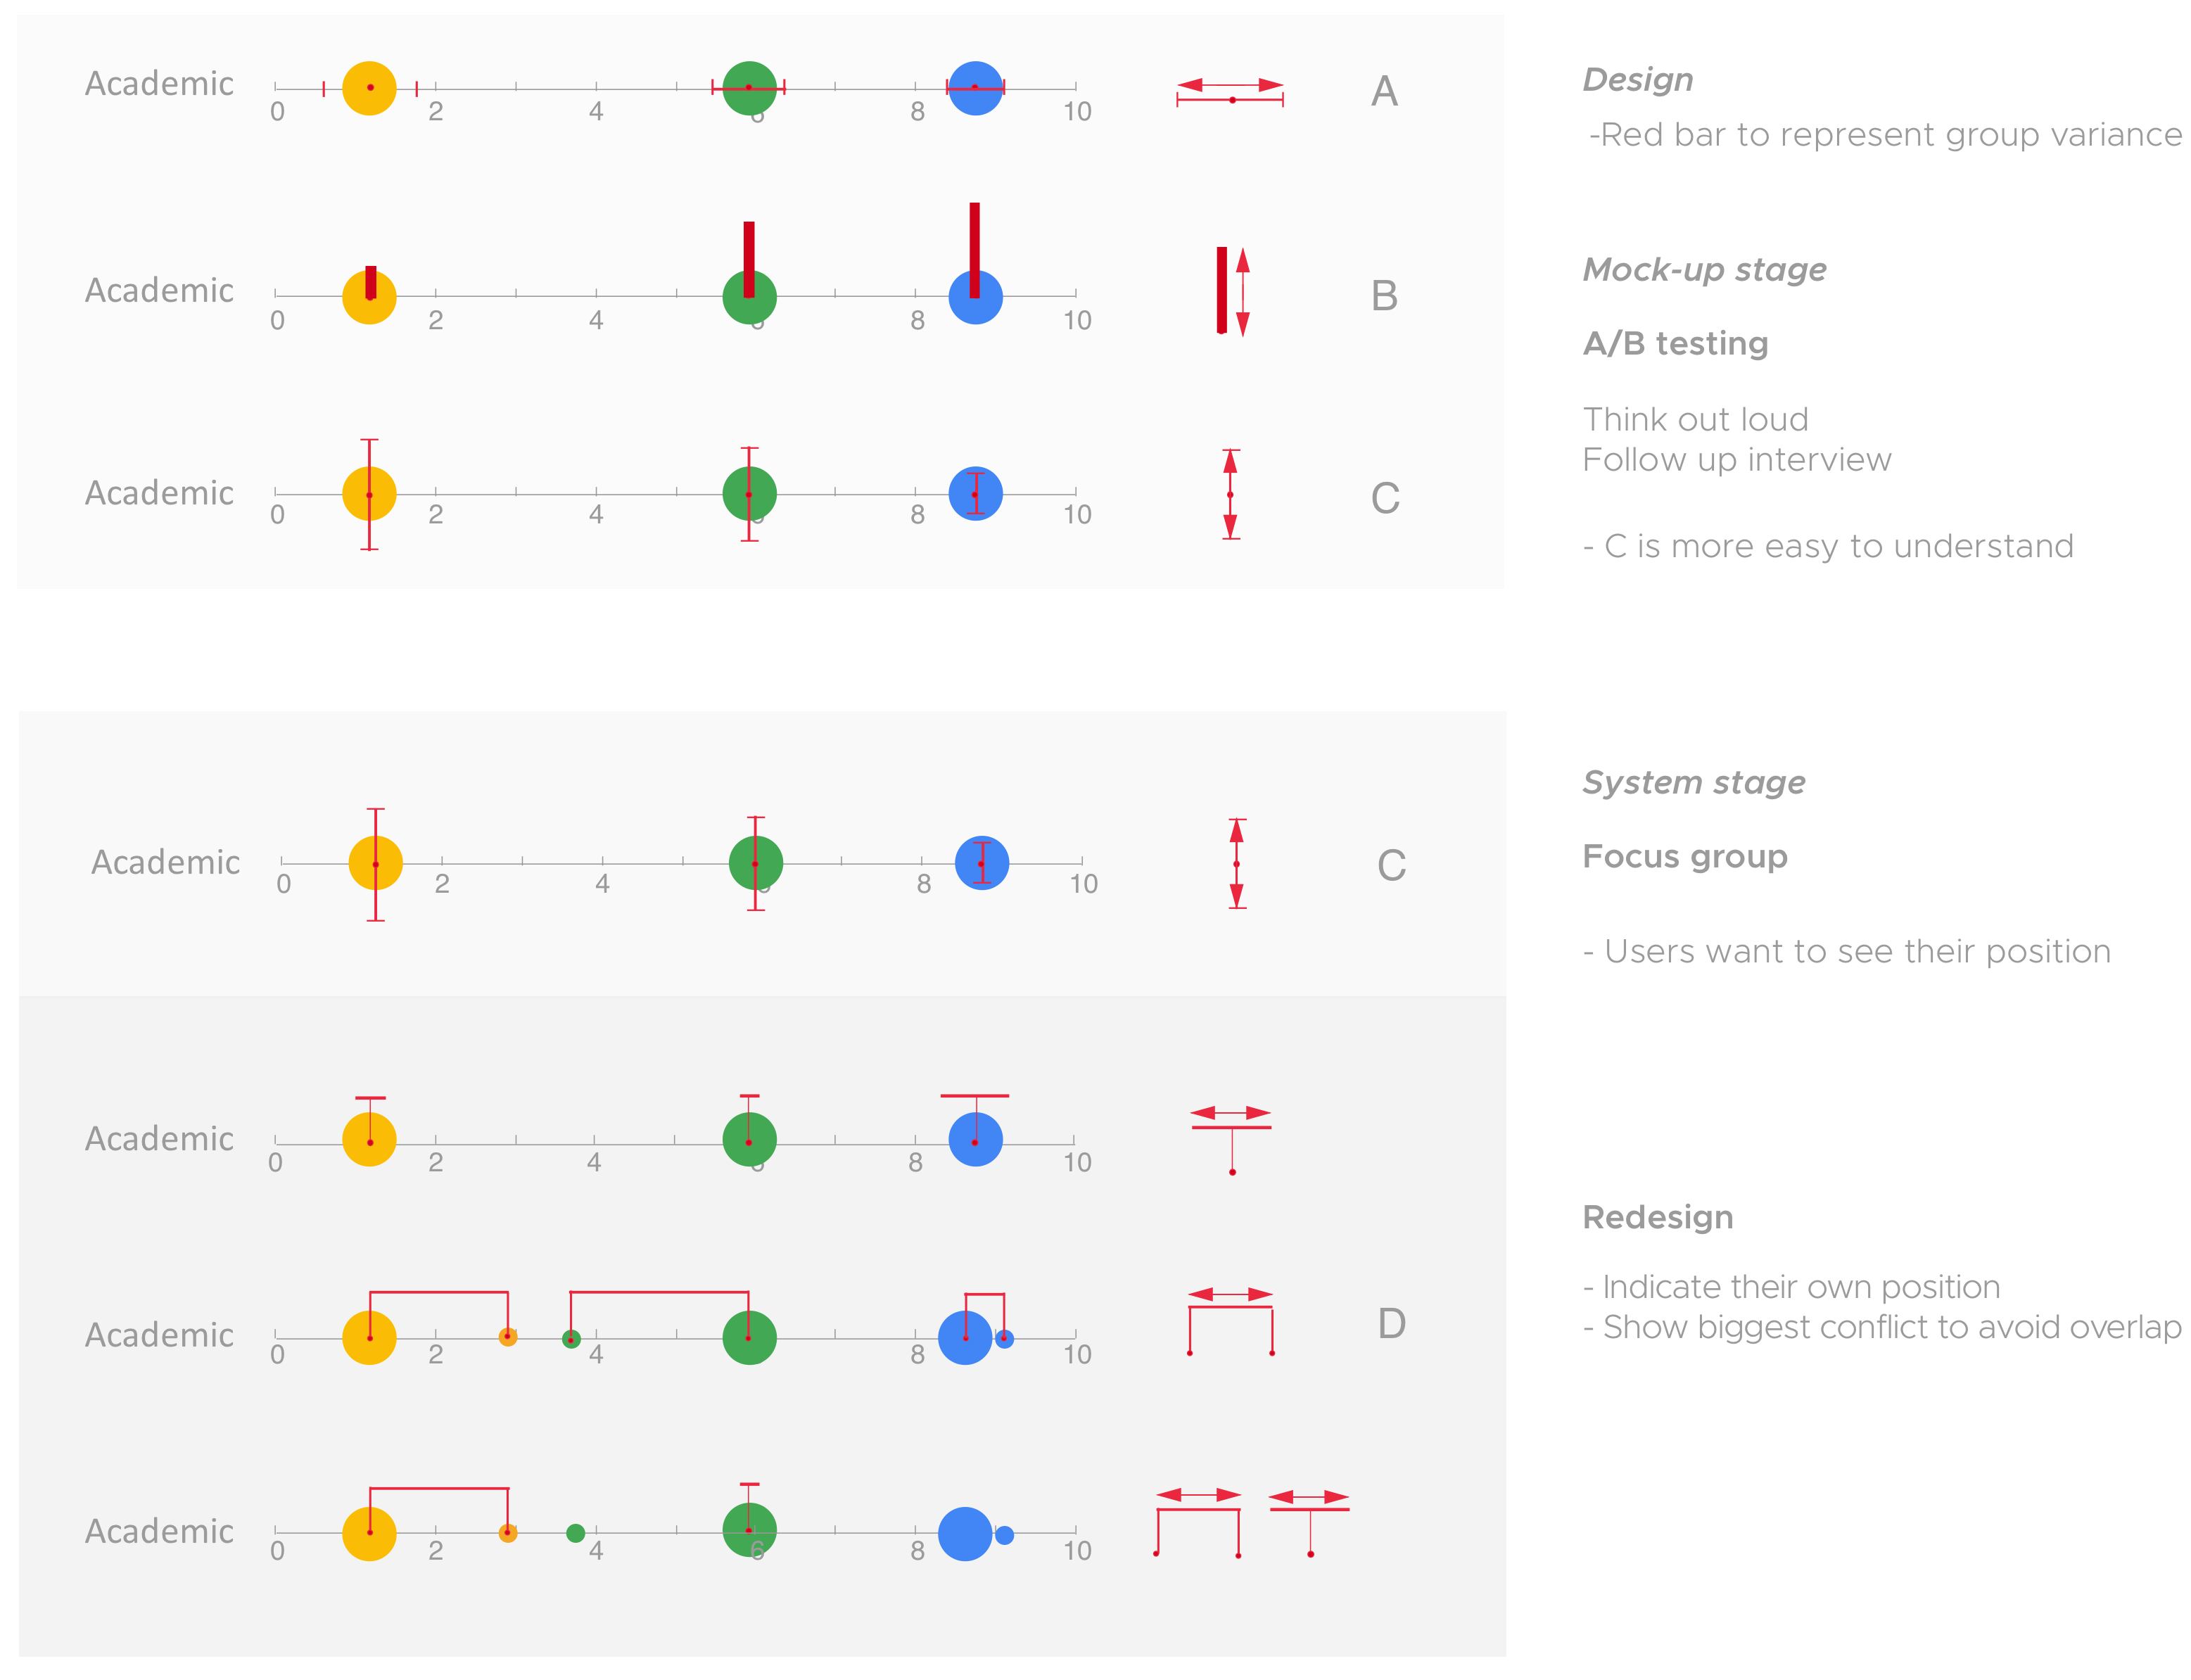
Ideation Process
We conducted individual interviews and focus groups in which we ask participants to accomplish tasks with different visualization designs. We also ask visualization expert to evaluate our prototype.
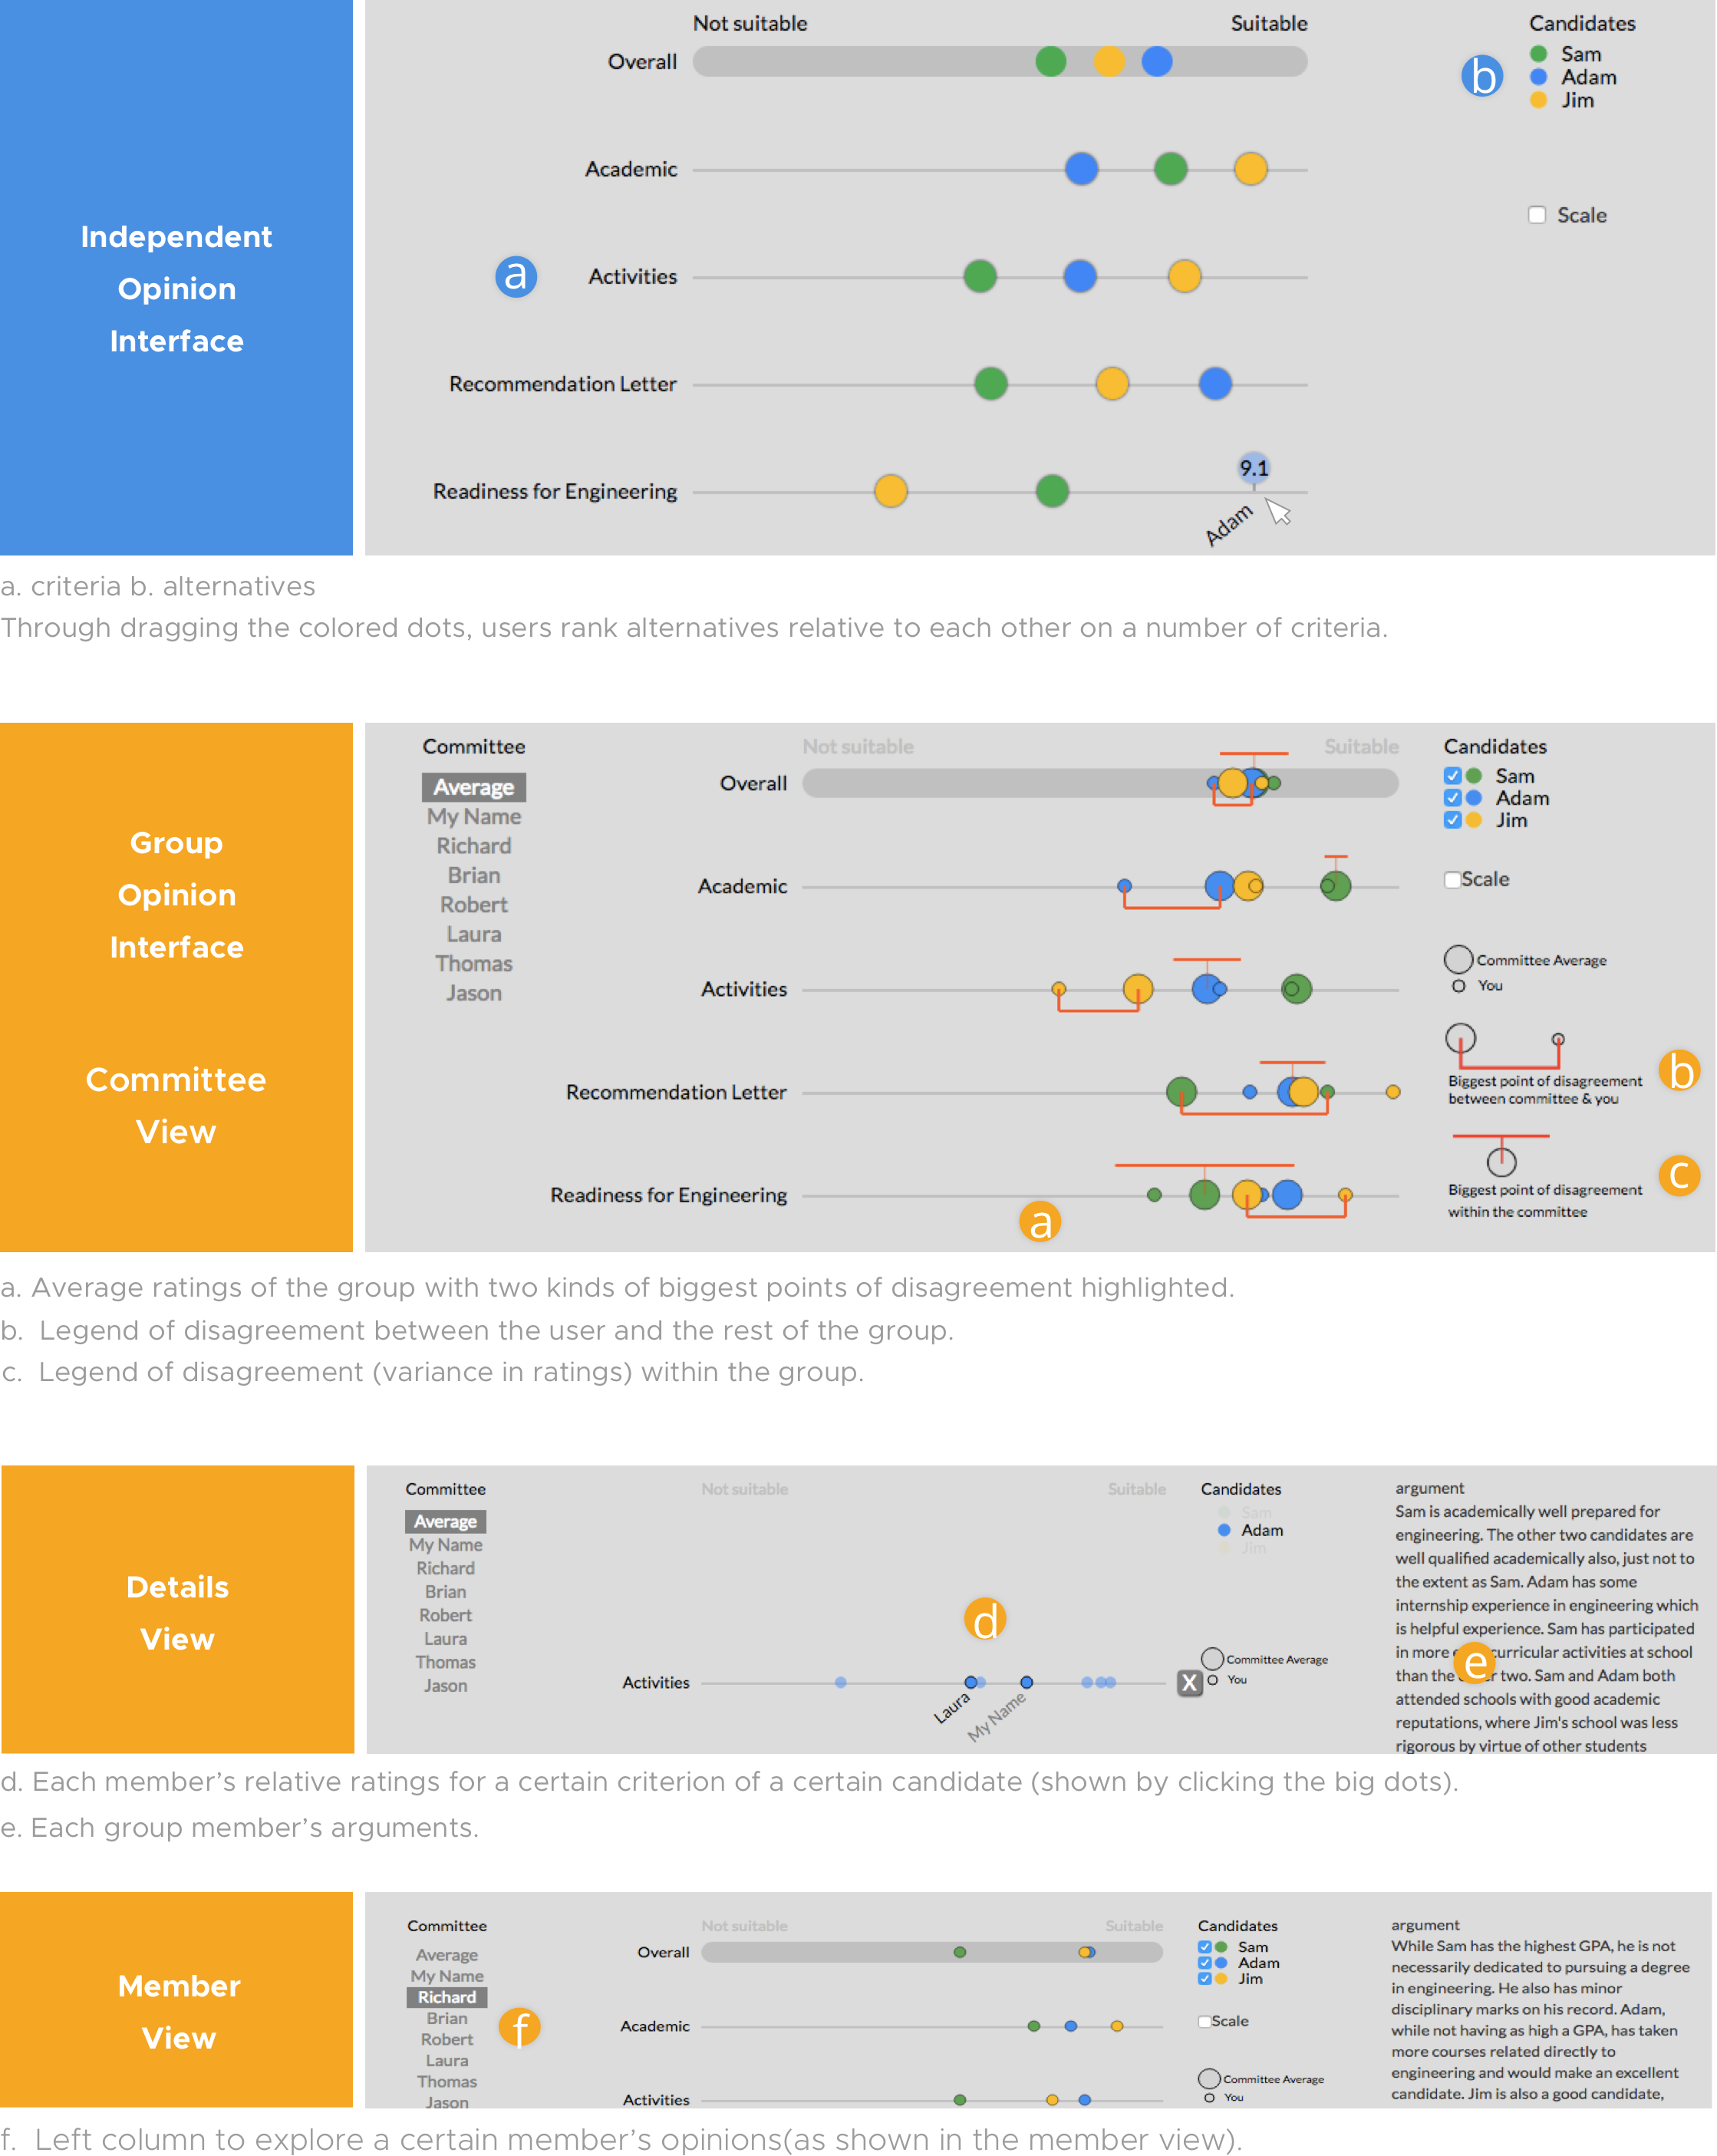
Individual Voting View
Group Convergence View
Interaction Design
I implemented the system front end. All the interactions are created with D3/Javascript.
Hover: Candidate name show up
Draging: Pop up ballon with score change (with pointer)
Hover: Candidate name show up
Draging: Pop up ballon with score change (without pointer, see clearer)

Hover: Order change to solve overlay problem
Dragging: Overall average score cannot be dragged
Overall score change after all critieria scores are assigned
Click: See each candidate's score components
Checkbox: See each candidate's score separately
Hover: See each voter's score
Prototype
User Experiment
Task Design
Candidates’ profile
We try to create even chance for best candidate to examine how people are influenced by others’ opinion. We create three faked candidates’ profile. In the individual voting stage, we want users’ choice of the best candidate to be evenly distributed among the three candidates so that we make sure users’ change of opinion on the best candidate is influenced by others’ opinion rather than the profile itself. We ask users to rate the candidates in individual and group interviews and we also run survey to see the distribution of best candidiates.
Hidden information
We create hidden information in the profile to test information sharing in group discussion. In the real world, even people are looking at the same material, they have different focus and may omit some facts while emphasing on others. In order to create more contrast to test how people share information in the group discussion phase, we hand each participant slightly different profile of three candidates. We will notice if they mention the hidden information in the group discussion page, and see if the hidden information influence their decision by seeing if they change their opinion after the group discussion and whether they use the corresponding hidden information as rationale to change the rating.
Confederate pool
We decide to conduct online individual experiment for better control of the experiment. In order to stimulate the exchange of opinions in group discussion, we gather the voting result and rationale in mechanical Turk as confederates and use them as representatives of group members.
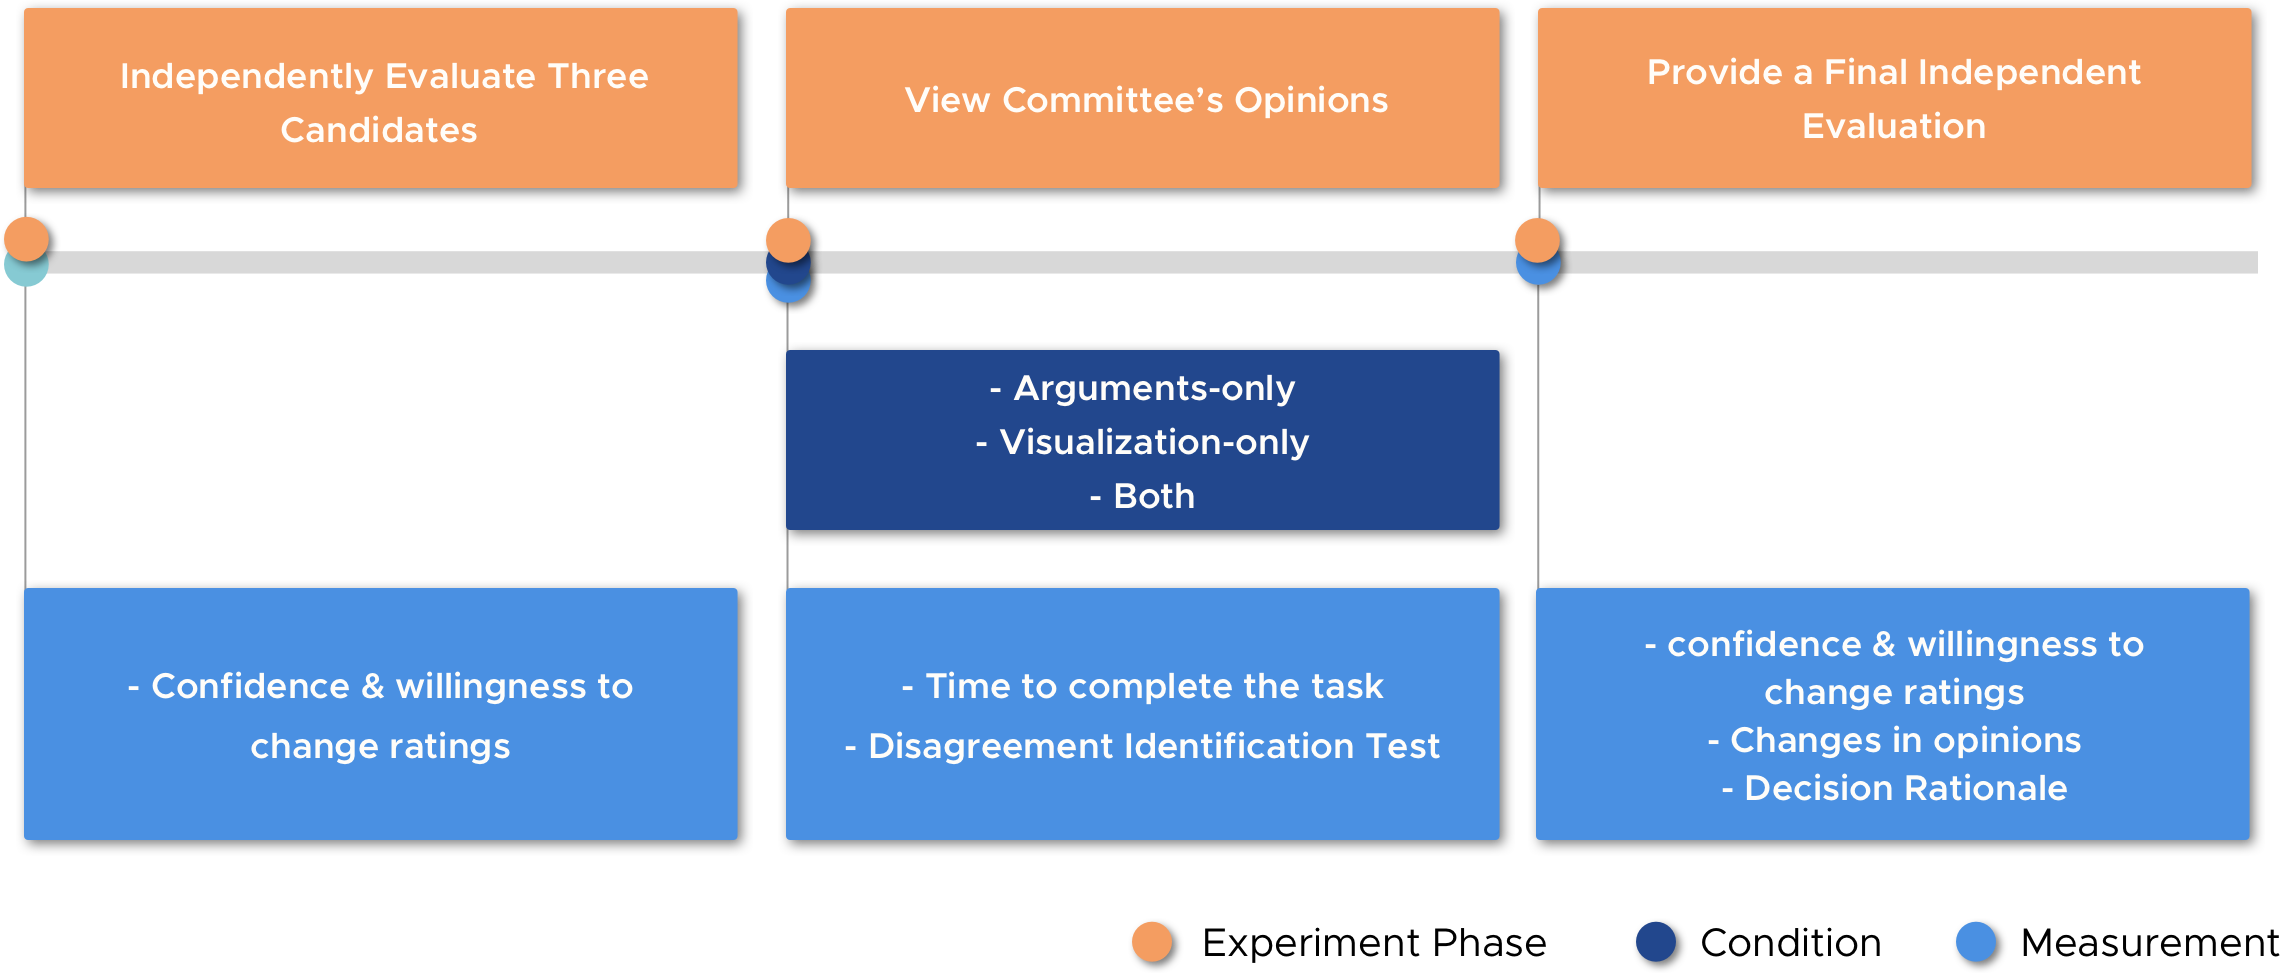
Hypothesis and measurement
H1: Participants can more accurately identify points of disagreement with a visualization of quantified subjective opinions than with written arguments. Our study treats this as a manipulation check and measure this with an objective test and a subjective questionnaire.
H2: Participants will give more concrete rationale to support their decision rationale when viewing written arguments. Our study operationalizes this by analyzing the relative amount of decision reasoning (as opposed to process comments) in participants’ response to an open-ended question about their decision.
H3: Participants will align their opinion more with the group opinion when they view both a visualization and written arguments of subjective opinions. Our study will measure this by counting changes in the ranking of alternatives, calculating an overall and relative change in ratings, and by open coding participants’ reasons for changing their ratings.
Experiment Procedure
Our evaluation focused on the relative benefits of disagreement highlighting as a supplement to written arguments. We conducted a between-subjects experiment with 87 participants taking part in a mock admissions committee for an engineering program.
Quantitative Analysis
Participants were fairly distributed across the three candidates as the best choice (37.9%, 34.5% and 23.0% respectively, plus 4.6% participants who rated multiple candidates as the best). For the eight disagreement test questions, participants correctly answered 4.01 questions on average (σ=2.26). Overall, 36.8% participants changed their ratings to align with the group. Only 5.7% changed their scores to be farther away from the group average. 57.5% did not change their scores to be farther or closer from the group. 16.1% of participants changed their ranking for a different best candidate.
For participants’ self-assessment of confidence and willingness to change ratings before and after viewing group opinions, we found that participants had significantly higher confidence after viewing group opinions (one-tailed paired T-test, t(86) = −1.97,p < 0.05) and significantly lower willingness to change ratings after viewing group opinions (one-tailed paired T-test, t(86) = 4.87, p < 0.05). We found no significant difference across conditions.
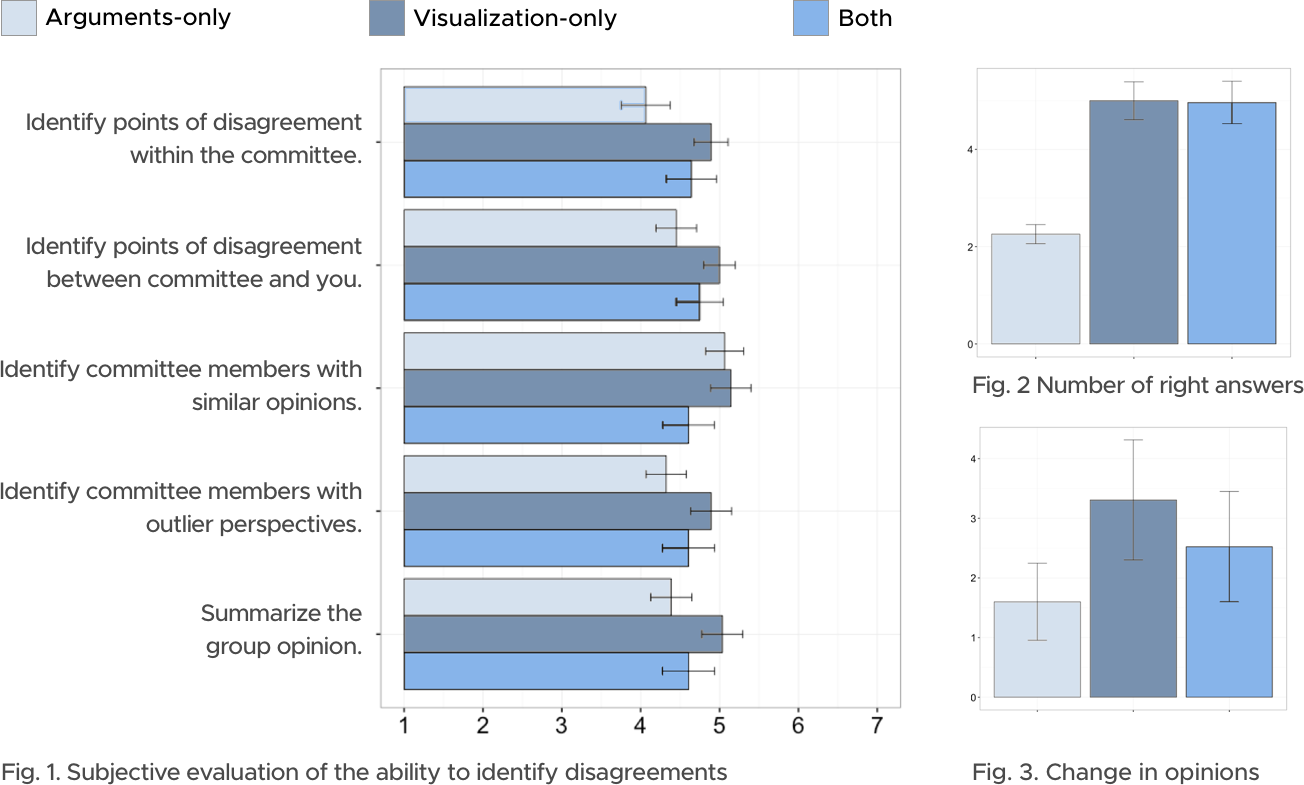
Disagreement Identification Test
After the answering the objective questions, participants answered five self-assessment questions on their ability to reason about the committee and to identify disagreements (See Fig. 1). we asked eight multiple-choice questions which all have objective answers that can be calculated based on ratings from the participants and the confederate committee (See Fig. 2).
Changes in Opinion
We measured how participants changed their ratings from before to after viewing the group opinions by their ratings change (See Fig. 3).
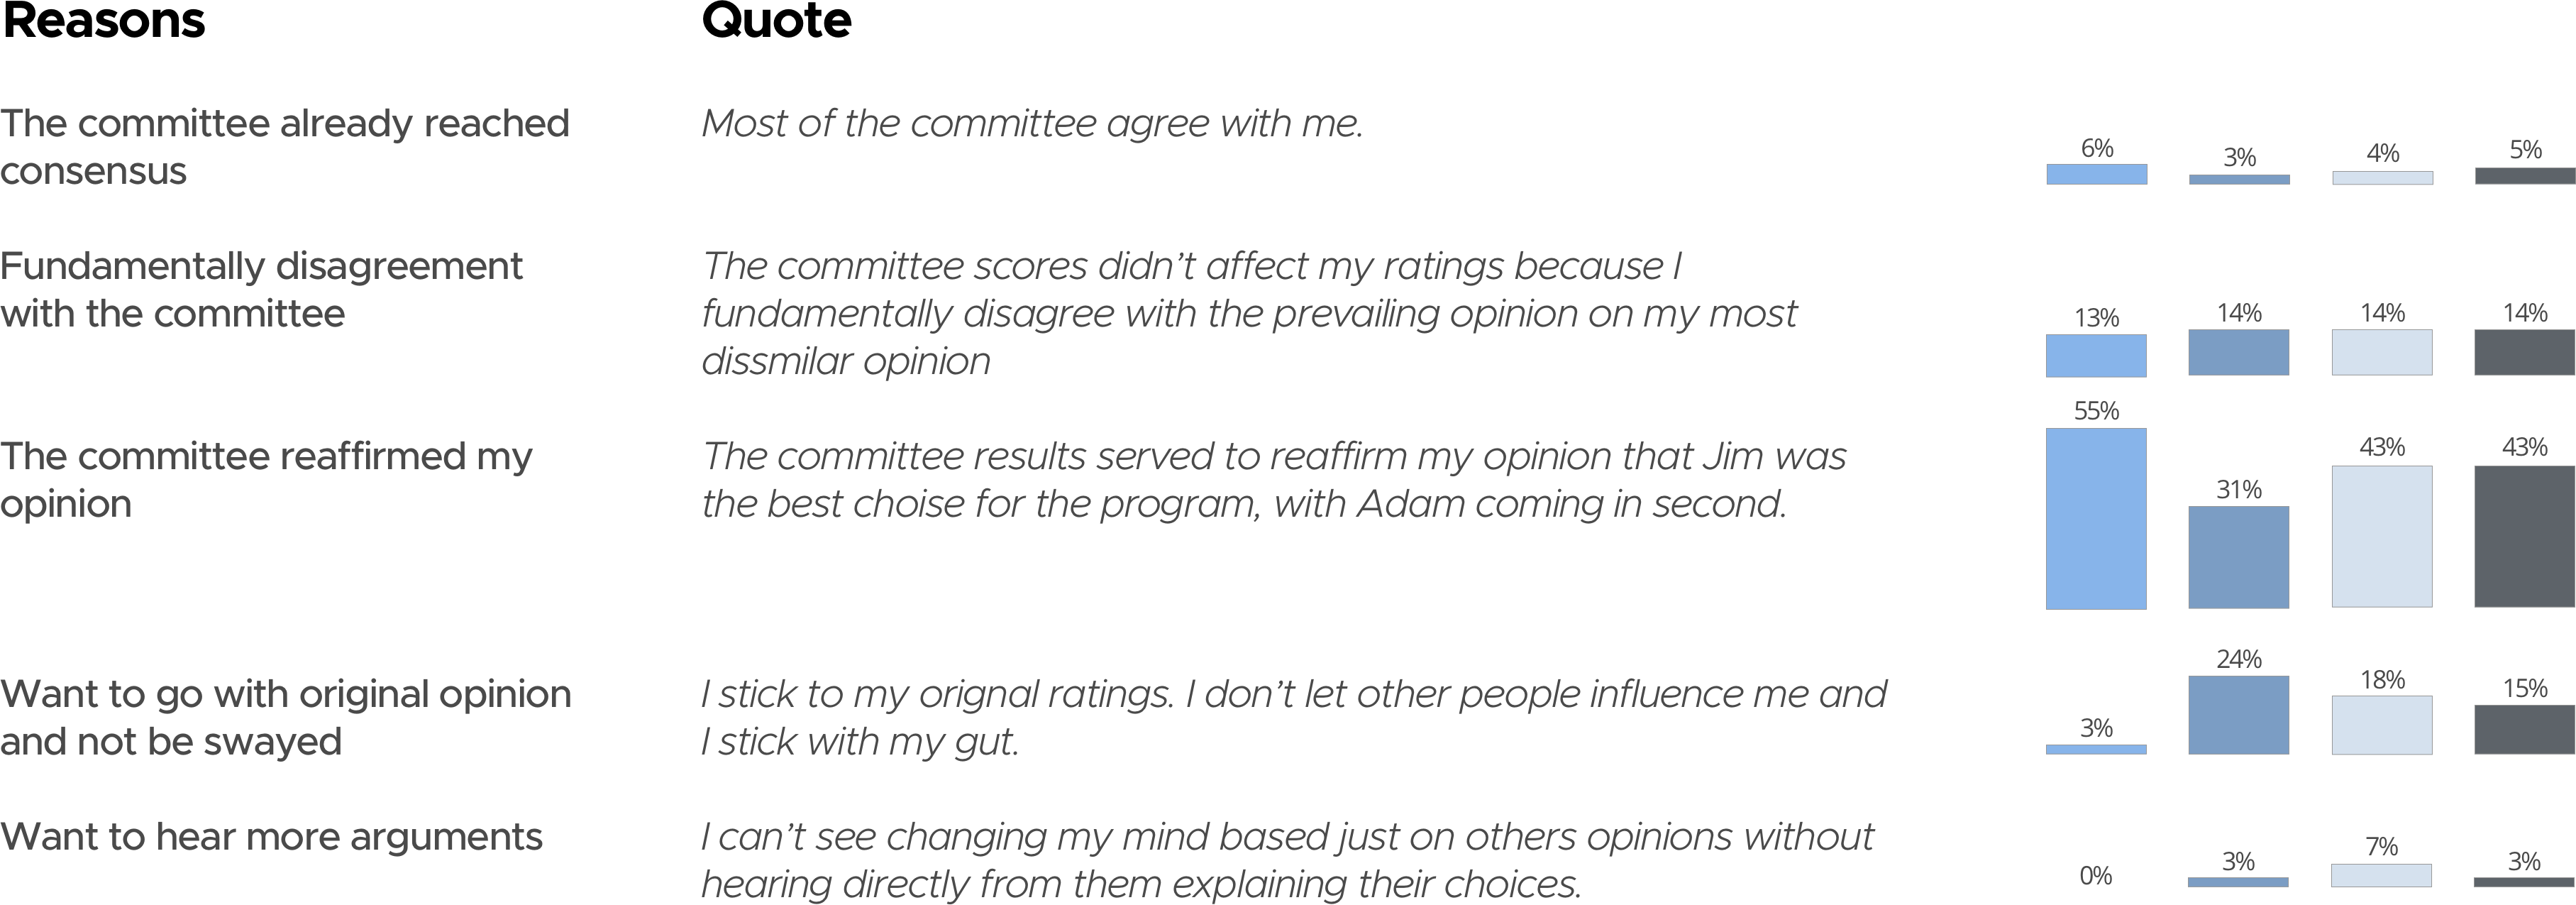
Qualitative Analysis
After the group stage, participants were asked an open-ended question to articulate the reasons for their decision. We analyzed the percentage of words devoted to concrete rationale versus statements about their process or strategy for making a decision. The results show that an average of 51% of the words in each participant's rationale in the Arguments-only condition can be categorized as concrete rationale, compared to 28% in Visualization-only and 29% in Both condition.
Changed Ratings
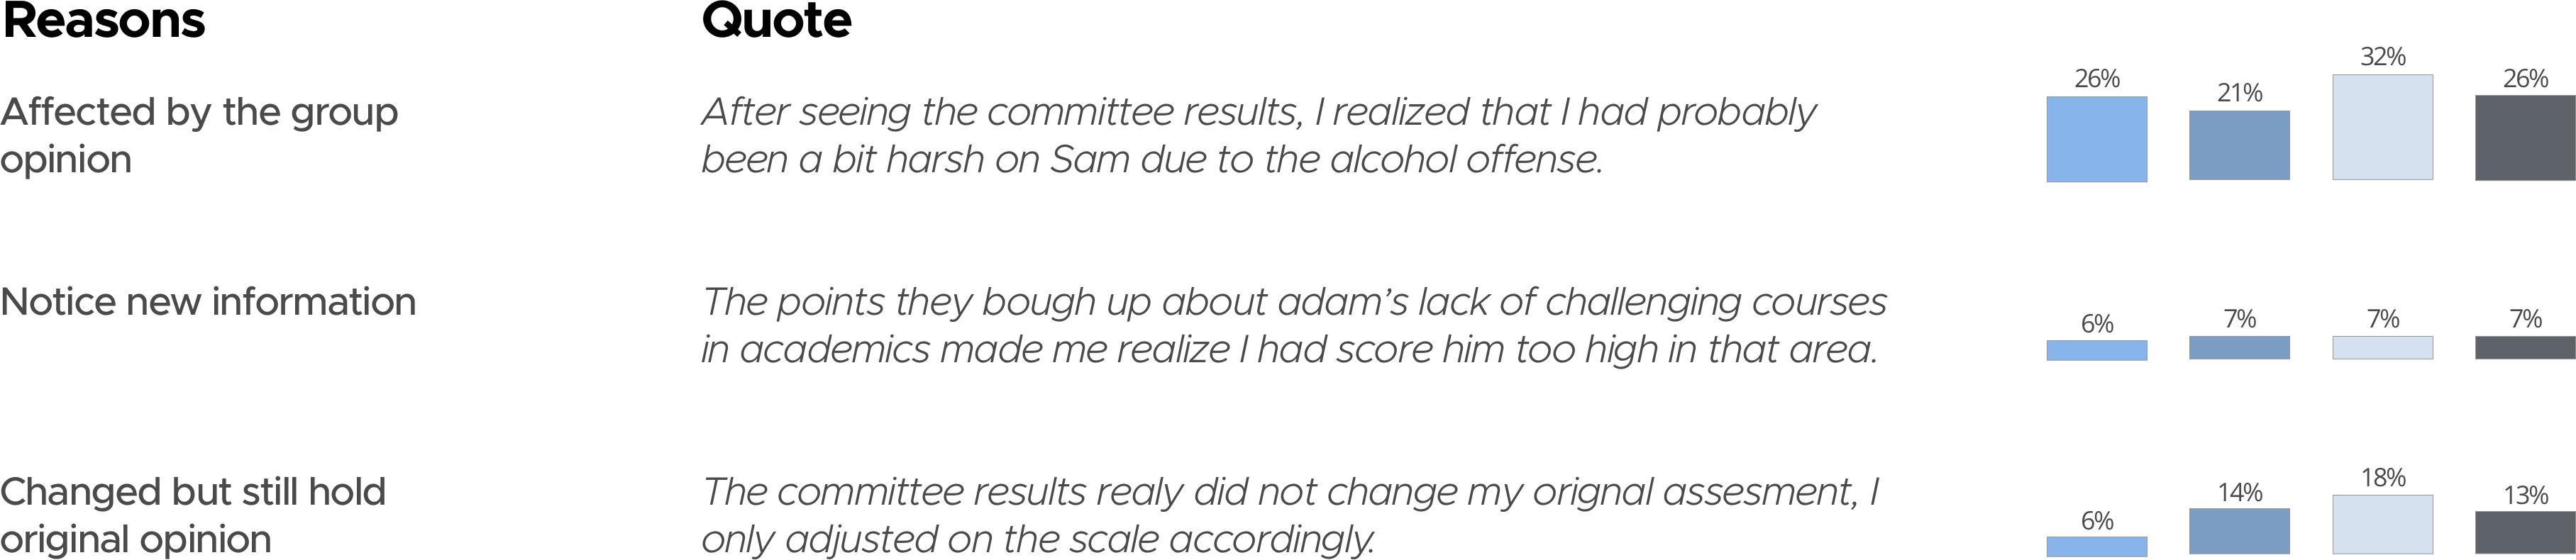
Did Not Change Ratings